Don’t look back. You’re not going that way
Anonymous
Tracking Momentum

Tracking Momentum
In sports, match momentum is tracked not by the current score, but team managers track the number of shots on goal and time of possession, on-base percentage and walks/hits per innings pitched, rebounds and turnovers. They do this not because the score doesn’t matter, but because the score is backwards-looking, and the aforementioned metrics are better predictors of future performance.
As we track inflation, our most commonly used “score” comes in the form of the Consumer Price Index (CPI), which is posted monthly but is similarly backwards-looking. To track the momentum of inflation, though, analysts are looking at other measures to predict future price growth. They track data such as inflation expectations, commodity spot prices, delivery times, business investment, and order growth. The Federal Reserve is executing its policy decisions based on its forecasts of future inflation, not past history.
June’s CPI inflation reading came in over 9% for the first time since November 1981. Yet while this headline number is indeed alarming, there are growing signs that the worst of inflation may already be behind us. In fact, despite the recent inflation report, consumers’ long-term inflation expectations have fallen to a 12 month low.
A Key Stat that Matters Right Now
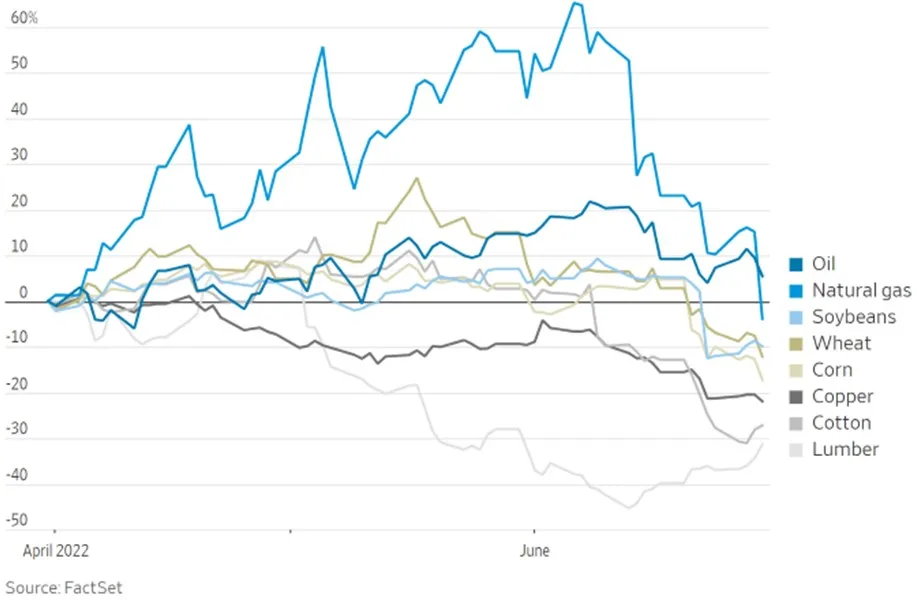
One particularly important measure is commodity prices. Commodities, which make up key inputs in the production of goods, have historically had a very tight relationship with inflation.
The Bloomberg Commodity Spot Index has fallen 19% over the last month, giving up the majority of its gains since the start of the year.
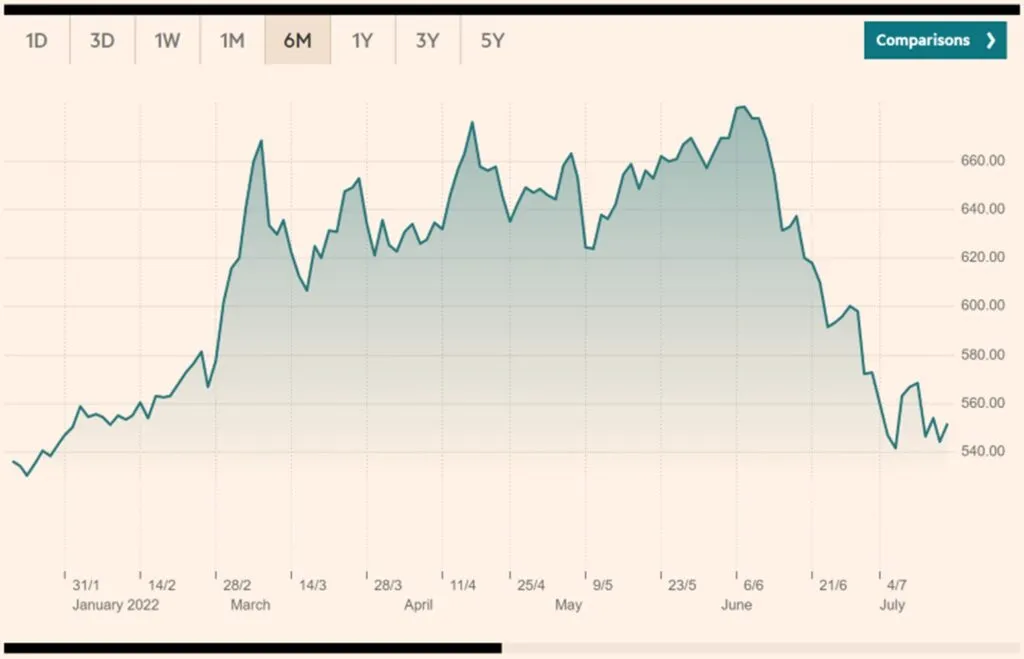
Oil prices have dropped about 15% since June. Other commodities are rapidly falling as well. Wheat, copper, and steel prices have declined in recent weeks. The pullback in commodities suggests prices may begin easing in the coming months.
Supply Chains Showing Signs of Recovery
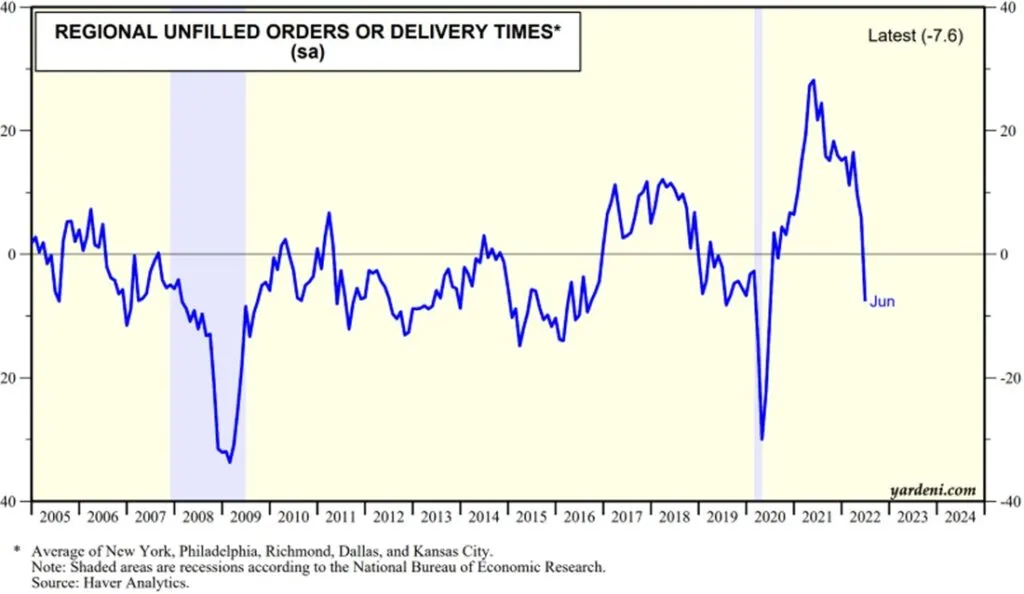
While it’s premature to say that supply chains are back to normal, a number of indicators are showing improvement. Supplier delivery times, for example, fell significantly in the New York and Philadelphia Fed regions. Kansas City and Richmond also shortened, while Dallas was worse. Overall, though, the data across the five regions is encouraging.
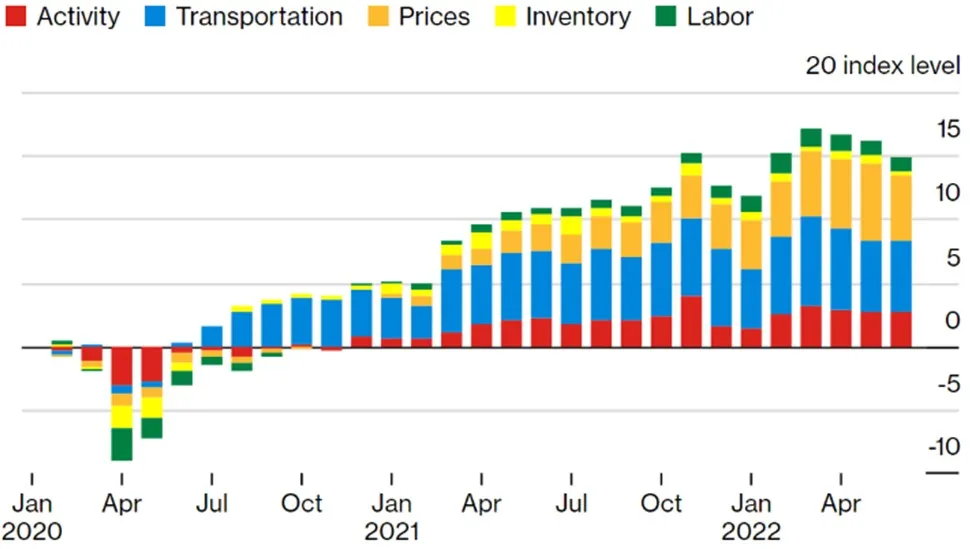
The Oxford Economics US supply-strain index has also fallen for three straight months with logistics looking healthier as the balance between inventory and demand is improving, albeit still at elevated levels.
Similarly, in the Fed’s Beige Book last month, Bloomberg reported that the frequency of the reserve bank’s referrals to “shortage” fell from 59 to 27 since March.

Fed, You’re on the Clock
One could argue that these signals pointing to slowing inflation, particularly lower commodity prices and decreasing demand for goods, are in anticipation of strong Fed action. With their next two meetings on July 28-29 and September 15-16, they will seek to thread the proverbial needle by balancing two things: 1) avoid tipping the economy into a recession or exacerbating the situation if we’re already in one and 2) tightening monetary policy aggressively enough to maintain credibility.
Following June’s CPI report, the Fed Fund futures suggested that the odds of a 1% rate hike instead of 75 basis points jumped from 7% to 80%, before settling back to 30%.
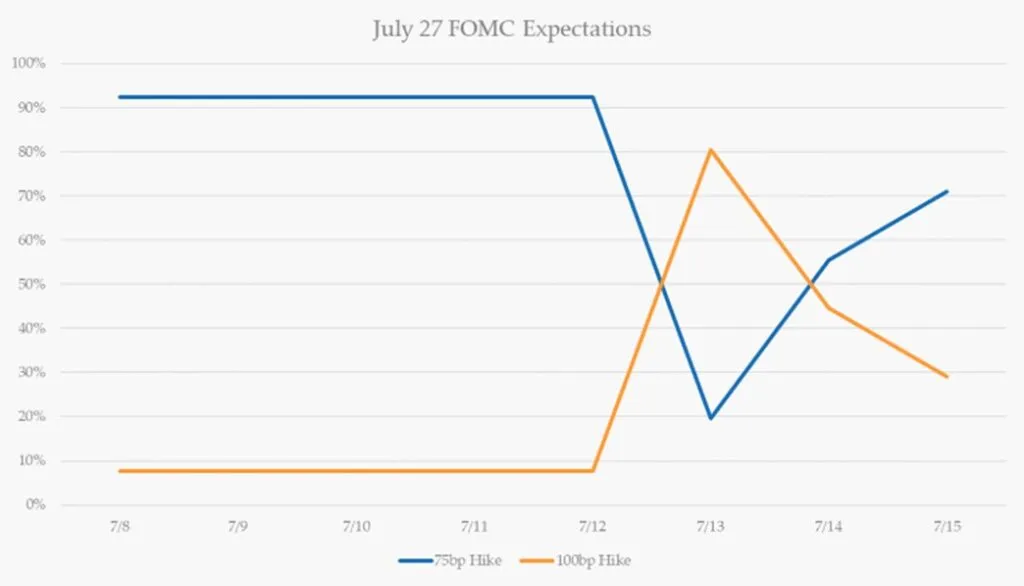
In recent days, the Wall Street Journal cited comments from Fed Governor Christopher Waller and Fed Kansas City President Esther George, suggesting a 75 basis point hike this month remains the more likely scenario.
The Curve Has Inverted (Again)
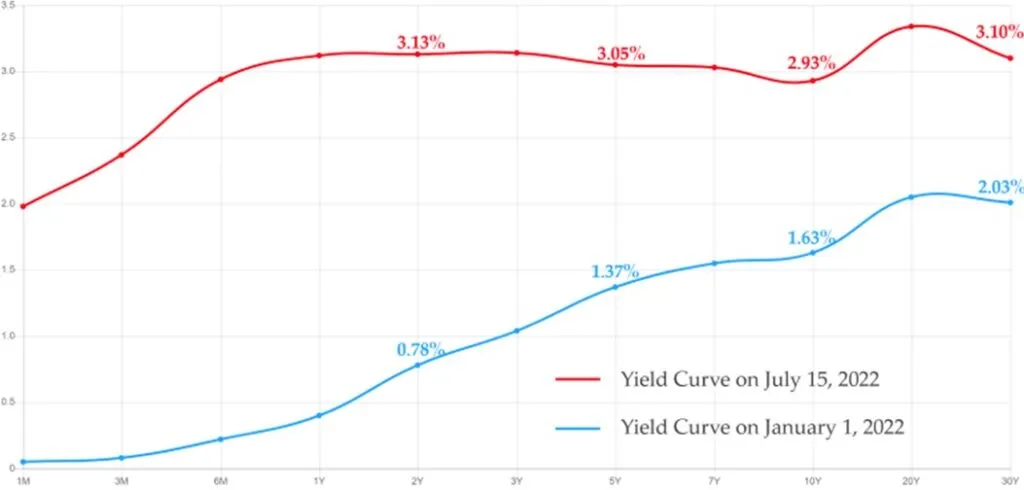
Over the last month, investors have similarly tempered their long-term expectations of the Fed. 10-year treasury yields, after hitting a high of 3.49% on June 14, pulled back to 2.93% a month later. With the 2-year treasury yield still above 3%, the traditional 2-10 spread has inverted once again, heightening the prospects of a recession.
Time to Finally Cut the Outlook?
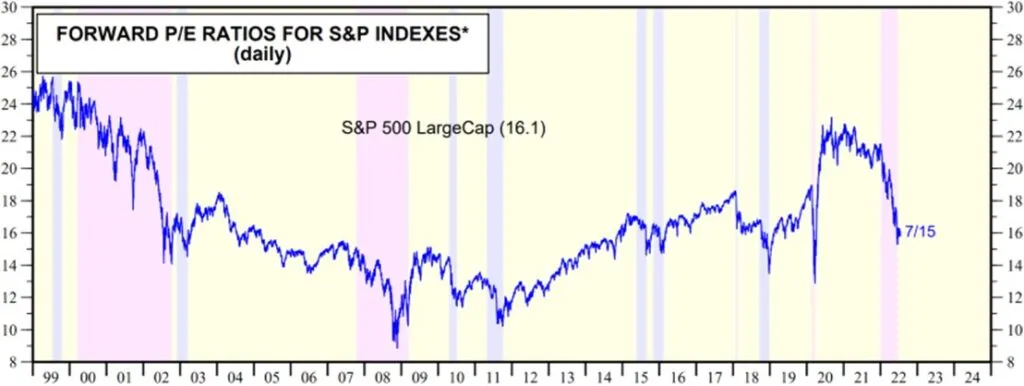
With 2Q earnings season underway, the street is forecasting earnings growth of 4.2% for the quarter but still estimating growth of 10.1% and 9.2% in Q3 and Q4, respectively. Market skeptics have been long awaiting earnings estimates to get reduced. This earnings season will be revealing as management teams provide greater visibility on the outlook for their companies. With the S&P 500 having seen its forward price to earnings multiple fall from 20x to under 16x this year, investors will evaluate whether the market has actually gotten cheaper or if analyst forecasts are simply behind the curve.
No Surprises Here
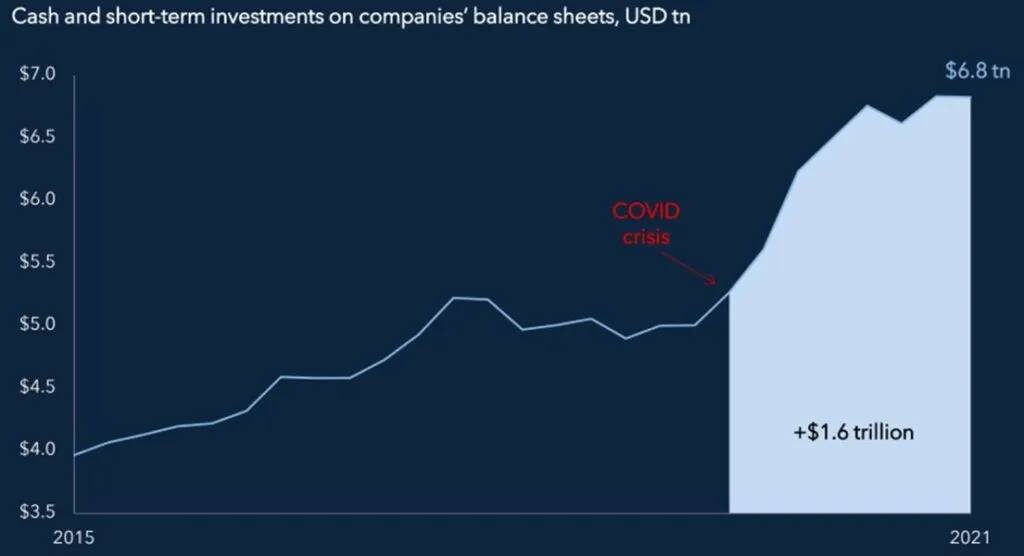
Talks of a potential recession have weighed on the collective discussion for well over a year. While markets historically don’t like surprises, this certainly wouldn’t be that. Consumers and companies have had ample opportunity to adjust to a changing environment, and should the economy indeed enter into a recession, they are better prepared this time around than they have been in the past. With more savings, lower mortgage and debt rates that were locked in, and a resilient labor market, some economic slowing can be tolerated. With odds of a recession increasing in recent months, however, the question is how much pain is needed to stamp out inflation?
Putting Points on the Board
While lower commodity prices and improving supply chains point to taming inflation, the shift in momentum will ultimately need to show up on the scoreboard. The Federal Reserve will need to see several months of price deceleration or even month-to-month declines in the CPI and the Core PCE (personal consumption expenditures) to be convinced that prices are back under control before loosening monetary policy again. Until that happens, markets are likely to remain volatile.
Click the button below to download a PDF version of the current Prudent Perspective.

